What Is Loss of Biodiversity? Causes, Drivers & UK Impact (2026 Guide)
Biodiversity loss is the long-term decline in the variety of life on Earth — genetic diversity within species, the number of species, and the range of ecosystems they form. The Intergovernmental Science-Policy Platform on Biodiversity and Ecosystem Services (IPBES) attributes it to five direct drivers: land- and sea-use change, direct exploitation of organisms, climate change, pollution, and invasive alien species. Globally, monitored wildlife populations have declined an average of 73% since 1970; in the UK, 41% of species show a strong or weak decline over the same period.
The framing matters because policy choices follow the diagnosis. Treating biodiversity loss as primarily a climate problem leads to one set of interventions; treating it as fundamentally a land-use and exploitation problem (which the IPBES evidence supports) leads to another. This guide walks through the IPBES framework, the 2026 UK data, six worked species examples, the ecosystem-service consequences, and the policy responses now in force — including mandatory Biodiversity Net Gain and the UK's 30 by 30 commitment.
73%
Wildlife Decline
WWF Living Planet Report 2024, since 1970
41%
UK Species Declined
Defra Indicators of Species Abundance, since 1970
47,000+
Species Threatened
IUCN Red List, March 2025 (~28% of assessed)
10%
Mandatory BNG
England, in force February 2024
Sources: WWF Living Planet Report 2024; Defra Indicators of Species Abundance; IUCN Red List 60-Years Report (Oct 2025).
Key Takeaway
Biodiversity loss is not primarily a climate problem. The IPBES global assessment ranks land- and sea-use change and direct exploitation jointly above climate change as drivers of species decline — meaning agriculture, fishing, logging, and infrastructure decisions matter as much as carbon emissions for whether nature recovers.
What is biodiversity loss? Definition and the IPBES framework
Biodiversity loss refers to the reduction of biological diversity at three nested levels: genetic diversity within populations, species diversity within communities, and ecosystem diversity across landscapes. The decline can be local (a single species lost from a region), regional (a habitat disappearing from a country), or global (extinction). Pixcellence's pieces on what biodiversity actually is and types of biodiversity explain the three levels in more depth.
The contemporary scientific consensus on what's driving the loss comes from IPBES — the Intergovernmental Science-Policy Platform on Biodiversity and Ecosystem Services. Its 2019 Global Assessment established the five-drivers framework that has since become the international gold standard, cited by Defra, IUCN, the Convention on Biological Diversity, and the UK's own National Security Assessment on biodiversity loss. The 2025 IPBES Transformative Change Assessment reinforced the original five drivers and added emphasis on the indirect drivers behind them: consumption patterns, population, governance, and economic systems that treat nature as a free input.
Crucially, IPBES doesn't treat the five drivers as equally weighted. Their assessment of relative contribution to global species decline puts land- and sea-use change and direct exploitation jointly at the top — together accounting for roughly half the threat — with climate change, pollution, and invasive species acting as amplifying factors. That ranking is the single most important thing the public conversation around biodiversity loss tends to get wrong.
The 5 causes of biodiversity loss: IPBES's five direct drivers, ranked
Below are the five direct drivers of biodiversity loss as set out by IPBES, in approximate order of impact, with the UK manifestation of each.
| # | Driver | UK manifestation |
|---|---|---|
| 1 | Land- and sea-use change | Agricultural intensification, hedgerow loss, drainage of peatlands and wetlands. The UK has lost an estimated 97% of its wildflower meadows since the 1930s. |
| 2 | Direct exploitation of organisms | Fishing pressure on UK sandeel and herring stocks, historic persecution of birds of prey, contemporary wildlife crime against raptors on grouse moors. |
| 3 | Climate change | Phenology mismatches (caterpillars emerging before nesting birds need them), range shifts of southern species into the UK, warming seas affecting marine food webs. |
| 4 | Pollution | Neonicotinoid impact on pollinators, agricultural nutrient run-off into rivers, sewage discharge into UK coastal waters, light and noise pollution. |
| 5 | Invasive alien species | Grey squirrel displacing red squirrel, signal crayfish out-competing native white-clawed crayfish, Himalayan balsam dominating riverbanks, harlequin ladybird predating native insects. |
Source: IPBES Global Assessment Report on Biodiversity and Ecosystem Services (2019) and IPBES Transformative Change Assessment (2025).
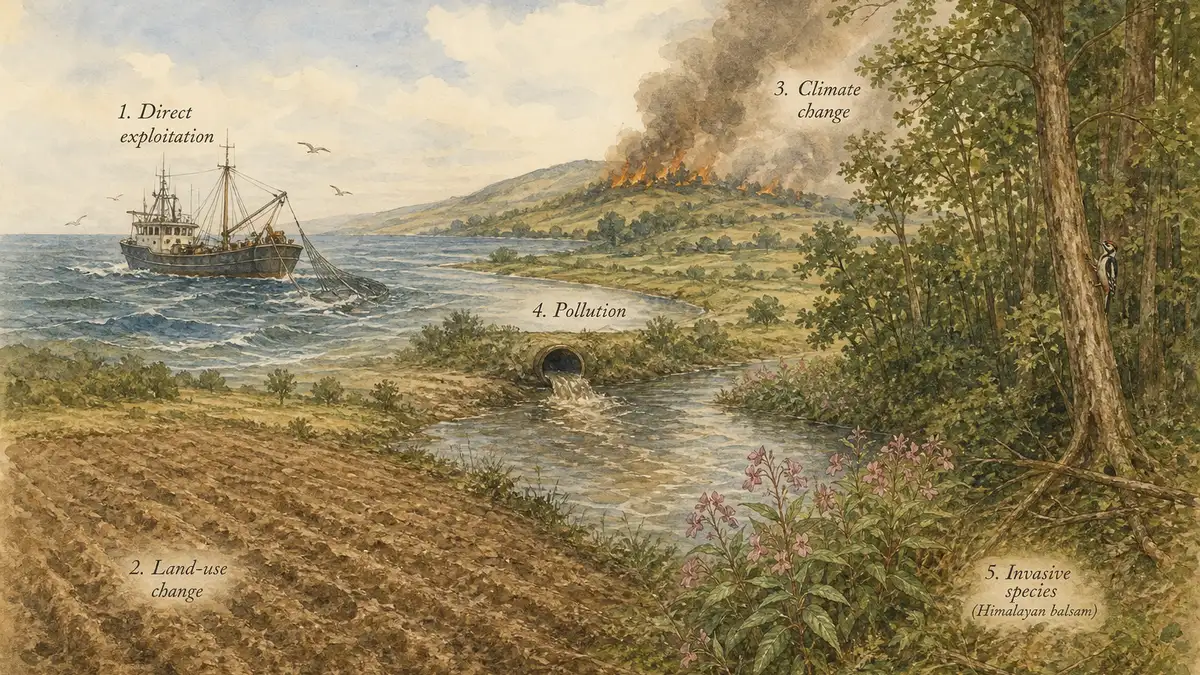
Driver 1 deserves its top ranking. The IPBES estimate that more than 75% of Earth's land surface has been significantly altered by human activity — a single statistic that explains a great deal of the biodiversity collapse pattern. UK readers will recognise this in the figure for wildflower meadows: a 97% loss since the 1930s, driven not by climate change but by post-war agricultural intensification, drainage, fertiliser application, and the loss of mixed farming. Pixcellence's piece on the 36 global biodiversity hotspots covers how this plays out at the international scale.
Biodiversity loss in the UK: how bad is it really?
Britain is one of the most nature-depleted countries in Europe. The Natural History Museum's Biodiversity Intactness Index — a measure of how much of an area's original wildlife remains — places the UK substantially below the global average and significantly below less industrialised European nations. Specific 2026 indicators from Defra and JNCC underscore the picture.
The headline figure from the Defra Indicators of Species Abundance in England is that, since 1970, 41% of species showed a strong or weak decline while 30% showed a strong or weak increase. The State of Nature partnership's complementary 2023 analysis adds that one in six species in Great Britain is now at risk of extinction. The JNCC UK Biodiversity Indicators 2025 show declines in pollinating insects of around 23% between 1980 and 2024, and continued downward pressure on farmland and woodland birds.
The UK government's own Office for Environmental Protection progress report (2024–2025) rated the country as showing "mixed or limited progress" on 31 of 43 statutory environmental targets — including biodiversity-relevant targets on species abundance, protected sites condition, and habitat creation. Britain is not on track for its own 2030 commitments without substantial acceleration.
Biodiversity loss examples: 6 UK species in steep decline
The six species below are documented UK biodiversity loss cases, each tracing back to one or more of the IPBES five drivers. They are useful examples for school projects, articles, and conservation campaigns because the cause-and-effect chains are well-evidenced and the recovery pathways are known.
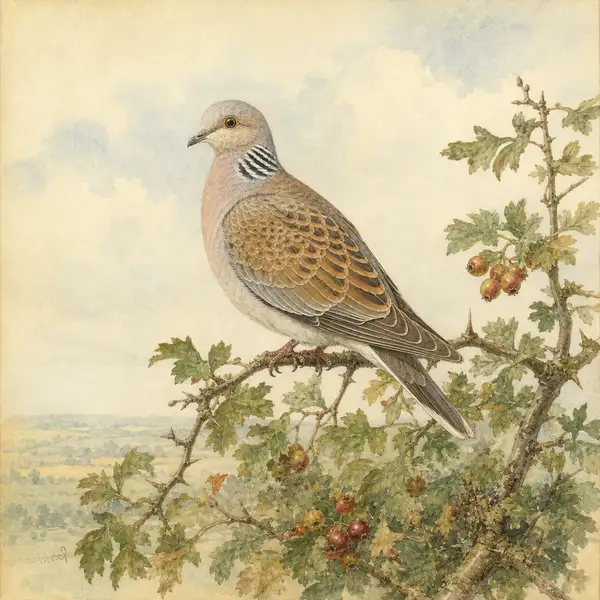
Turtle dove (Streptopelia turtur): The UK breeding population has fallen by more than 95% since the late 1960s. Drivers: agricultural intensification (loss of weed-rich field margins reducing seed supply) and hunting on migratory routes through Mediterranean Europe.
Water vole (Arvicola amphibius): The UK's fastest-declining mammal, now extinct from many of its former range across England, Wales, and Scotland. Drivers: predation by invasive American mink (driver 5: invasive species) and habitat loss along watercourses (driver 1: land-use change).
European eel (Anguilla anguilla): Critically endangered on the IUCN Red List. Drivers: direct exploitation through historic fishing, pollution barriers to migration, climate change affecting Atlantic spawning grounds.
Hedgehog (Erinaceus europaeus): Once ubiquitous in rural Britain, now red-listed as vulnerable. Drivers: hedgerow loss, road mortality, garden fencing fragmenting populations, pesticide impact on prey insects.
Pollinating insects (overall trend): JNCC indicators show a 23% decline in occupancy between 1980 and 2024 across UK bee and hoverfly species. Drivers: pesticide exposure, habitat loss, climate change altering flowering phenology.
Atlantic salmon (Salmo salar): Listed as endangered on the IUCN Red List in 2023. Drivers: warming rivers, pollution, dams and weirs blocking migration, and competition from escaped farmed salmon. For richer context on cause clusters, see our piece on how biodiversity loss drivers stack in hotspot regions.
Why biodiversity loss matters: ecosystem services, food, public health
The economic case for biodiversity is not abstract. England's nature services were valued at more than £37.1 billion annually in the 2025 Environmental Improvement Plan analysis. UK pollination services alone have been estimated at between £500 million and £1 billion per year, supporting fruit, vegetable, and oilseed crops. The Food and Agriculture Organisation estimates that 75% of global food crops depend at least in part on animal pollination — a dependence that translates directly into supermarket shelves.
National Security Concern
The framing: The UK Cabinet Office's 2024 National Security Assessment on Global Biodiversity Loss explicitly identifies ecosystem collapse as a national-security risk — not just a conservation issue.
Why this matters: Biodiversity loss is now treated alongside climate change in UK risk planning, with implications for food security, supply-chain resilience, zoonotic disease emergence, and water and pollination services that underpin the economy.
Beyond economics, biodiversity loss feeds into public health. The post-COVID literature has firmed up the link between habitat degradation and zoonotic disease emergence: as wild habitats are converted, the contact zone between wildlife and people widens and the risk of spillover events increases. NHS green social prescribing programmes — backed by Forestry England and the Wildlife Trusts — recognise the inverse: time in biodiverse natural environments measurably improves mental health, with implications for the UK's £118 billion annual mental health cost. Pixcellence's piece on why biodiversity matters develops the human-wellbeing argument in more depth.
Global context: IUCN Red List, Living Planet, planetary boundaries
The UK figures sit within a global picture that is equally stark. The IUCN Red List, as of March 2025, has formally assessed more than 169,000 species; over 47,000 of them — approximately 28% — are threatened with extinction. The proportions are higher for some groups: around 41% of amphibians, 25% of mammals, 21% of reptiles, and 14% of birds.
The WWF Living Planet Report 2024 documents an average 73% decline in monitored vertebrate populations since 1970, drawing on the Zoological Society of London's Living Planet Index. Freshwater populations have fallen the most steeply (85% decline), followed by terrestrial (69%) and marine (56%).
The Stockholm Resilience Centre's planetary boundaries framework now places seven of nine planetary boundaries in the high-risk transgression zone — including biosphere integrity, which is the closest scientific proxy for biodiversity loss. The 2025 IPBES Transformative Change Assessment was explicit on the implication: marginal improvements within existing economic and governance systems are insufficient. The framework's word is "transformative," not "incremental." Pixcellence's climate change and biodiversity piece explores how the two crises compound each other.
What the UK is doing: BNG, 30 by 30, EIP 2025, Environment Act
The headline UK policy response over 2023–2026 has three legs. The first is mandatory Biodiversity Net Gain, which came into force in England in February 2024. Any development subject to environmental impact assessment must now demonstrate a net gain of at least 10% in biodiversity value, calculated using Defra's statutory biodiversity metric. England is the first jurisdiction in the world to make BNG mandatory on this scale, though independent assessments — including the OEP's — caution that implementation effectiveness is still uncertain pending several years of monitoring.
The second leg is the 30 by 30 commitment: protecting 30% of UK land and sea by 2030, in line with the Kunming-Montreal Global Biodiversity Framework adopted at COP15 in December 2022. The headline coverage figures look reassuring — broad designations cover roughly a quarter of UK land and over a third of UK waters on paper — but Defra's own progress reporting shows that only around 7.1% of England's land currently meets the 30 by 30 standard of being both protected and in favourable or recovering condition (SSSIs in good condition plus qualifying landscape designations). Marine coverage is similarly inflated by designation: while 38% of UK seas hold some protected status, only around 5% are fully or highly protected, and bottom-trawling continues in the majority of UK MPAs. JNCC's "Beyond Boundaries" work argues that meeting 30 by 30 in substance, not just designation, requires significant expansion of Other Effective Area-Based Conservation Measures (OECMs) and tighter management of existing sites.
The third leg is the Environmental Improvement Plan (EIP) 2025, which restates the Environment Act 2021's statutory targets — including the commitment to halt species decline by 2030, restore 500,000 hectares of habitat by 2042, and create 75,000 hectares of wetland by 2050. The OEP's 2024-2025 progress report rates 31 of 43 statutory targets as showing "mixed or limited progress." Internationally, the October 2024 CBD COP16 in Cali operationalised the Kunming-Montreal monitoring framework and established a biodiversity finance facility, marking the move from commitment to implementation.
UK conservation wins: beavers, red kites, Knepp, rewilding
Biodiversity loss is reversible. The evidence comes from species reintroductions and landscape-scale rewilding projects where recovery is now well-documented. UK red kite populations, once down to a handful of breeding pairs in mid-Wales, recovered to over 4,600 breeding pairs by 2020 following reintroductions begun in 1989. The large blue butterfly, declared extinct in Britain in 1979, has been successfully reintroduced and now breeds at over 30 sites in southern England.
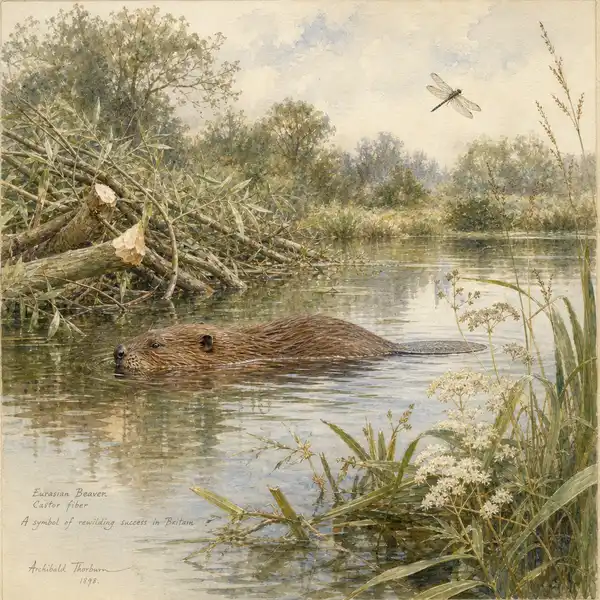
Beaver reintroduction marks a particular shift in 2025. In February 2025 Defra published landmark policy on wild release and management of beavers in England, moving from enclosed beaver enclosures to free-ranging landscape-scale reintroduction. Beavers create wetland habitat that supports dragonflies, amphibians, water voles, and a cascade of associated species — and reduce flood risk for downstream communities.
Rewilding case studies provide the landscape-scale evidence. Knepp Estate in West Sussex, a former intensive farm, now supports the UK's only breeding population of purple emperor butterflies, returning nightingales, and the first English beaver kits born outside captivity in centuries. Cairngorms Connect — a partnership of landowners restoring 600 km² of forest, river, and peatland in the Scottish Highlands — is on track to be the largest habitat-restoration project in the UK. Pixcellence's guide to UK habitats covers the regional context.
How you can help reverse biodiversity loss in the UK
Record what you see
Citizen-science platforms — iNaturalist UK, the National Biodiversity Network, BTO BirdTrack — turn casual observations into data that underpins national indicators.
Make your garden a habitat
UK gardens cover an area larger than all national nature reserves combined. A pond, native plants, a hedgehog highway, and one un-mown patch make a measurable difference.
Support landscape-scale work
RSPB, Wildlife Trusts, Rewilding Britain, the Woodland Trust, and Fauna & Flora International deliver landscape-scale recovery that small-scale action cannot match.
Vote and respond to consultations
UK biodiversity outcomes are driven by Defra policy, agricultural subsidies, and planning law. Defra and the Environment Agency consult publicly on most significant changes — submissions matter.
Buy with biodiversity in mind
Certified sustainable produce — RSPCA Assured, Marine Stewardship Council, Soil Association — moves supply chains. Reducing palm oil, soy-fed meat, and tropical timber consumption shifts pressure off biodiversity hotspots. For classroom-display angles see our biodiversity poster ideas guide and the finding free biodiversity pictures companion.
Frequently asked questions about biodiversity loss
What is biodiversity loss in simple terms?
Biodiversity loss is the long-term decline in the variety of life on Earth — the diversity of genes within species, the number of different species, and the range of ecosystems they form. It can occur locally, regionally, or globally, and the pace since 1970 is unprecedented in human history.
What are the 5 main causes of biodiversity loss?
The IPBES Global Assessment identifies five direct drivers: (1) land- and sea-use change, (2) direct exploitation of organisms, (3) climate change, (4) pollution, and (5) invasive alien species. Land-use change and direct exploitation are jointly the largest, accounting for roughly half of the global threat to species.
How bad is biodiversity loss in the UK?
Britain is one of Europe's most nature-depleted countries. The Defra Indicators of Species Abundance show that 41% of UK species have declined since 1970, and one in six species is now at risk of extinction. The UK is not on track to meet its statutory 2030 biodiversity targets without significant policy acceleration.
Is biodiversity loss reversible?
Yes — at species and landscape scales, recovery is documented. UK red kites recovered from a handful of pairs to over 4,600 breeding pairs following reintroduction. Large blue butterflies, declared extinct in 1979, are now established at over 30 sites. Beaver wild-release policy in England (February 2025) marks a step-change in habitat restoration. Recovery requires sustained funding, scale, and protection from the original drivers.
Is climate change the main driver of biodiversity loss?
No. The IPBES Global Assessment ranks climate change third, behind land- and sea-use change and direct exploitation of organisms. Climate change amplifies the impact of the other drivers but is not itself the primary cause of species decline. Treating biodiversity loss only as a climate problem misses the dominant agricultural, fishing, and infrastructure drivers.
What is the difference between biodiversity loss and extinction?
Extinction is the permanent loss of a species. Biodiversity loss is the broader decline in the variety of life — including population declines that have not yet reached extinction, loss of genetic diversity within species, and degradation of ecosystems. Most biodiversity loss does not show up as extinction in the short term, which is why population indices like the Living Planet Index matter.
What is mandatory Biodiversity Net Gain in England?
Since February 2024, any major development in England subject to environmental impact assessment must demonstrate a net gain of at least 10% in biodiversity value, measured using Defra's statutory biodiversity metric. England is the first jurisdiction in the world to make this mandatory at scale. Independent assessments warn that long-term effectiveness depends on rigorous monitoring and enforcement.
Stay Connected with Conservation
Be the first to know about new guides, wildlife photography features, and conservation updates from across the UK and beyond.
Sources: IPBES Global Assessment (2019); IPBES Transformative Change Assessment (2025); Defra Indicators of Species Abundance; IUCN Red List 60-Years Report; WWF Living Planet Report 2024; JNCC UK Biodiversity Indicators 2025; OEP Progress Report 2024-25; Environmental Improvement Plan 2025; CBD COP16 Cali (2024); Natural England — wild beaver release (Aug 2025).