
Biodiversity loss is driven by five interconnected human-caused pressures identified by the Intergovernmental Science-Policy Platform on Biodiversity and Ecosystem Services (IPBES): habitat destruction through land-use change, direct exploitation of species through hunting and fishing, climate change, pollution, and invasive alien species. These drivers have caused a 73% average decline in global wildlife populations since 1970, with around one million species now facing extinction.
Key Takeaway
The five primary drivers of biodiversity loss are habitat destruction (the single largest cause globally), direct exploitation, climate change, pollution, and invasive species. In the UK — one of the most nature-depleted countries on Earth — species have declined by an average of 19% since 1970, with one in six now threatened with extinction. Recovery is possible: turtle dove populations rose over 30% after hunting was paused, and UK marine protected areas are showing measurable species gains. Understanding these drivers is the first step towards reversing them.
In This Guide
- How serious is the biodiversity crisis?
- What are the five main causes of biodiversity loss?
- Driver 1: Habitat destruction and land-use change
- Driver 2: Direct exploitation of species
- Driver 3: Climate change
- Driver 4: Pollution — plastics, pesticides and nutrients
- Driver 5: Invasive alien species
- Why is the UK one of the most nature-depleted countries?
- What policies exist to halt biodiversity loss?
- Can biodiversity loss be reversed?
- What can you do to help?
- Frequently asked questions
How Serious Is the Biodiversity Crisis?
The biodiversity crisis is unprecedented in human history. The 2024 WWF Living Planet Report documents an average decline of 73% in monitored wildlife populations since 1970, based on data from 5,495 species and over 35,000 population trends. This collapse is not hypothetical or theoretical — it is an observed reality affecting every major ecosystem on Earth.
The IPBES Global Assessment, synthesising the work of over 450 experts reviewing approximately 15,000 scientific papers, found that approximately one million animal and plant species face extinction in the coming decades unless human pressures on nature are substantially reduced. The assessment concluded that the average abundance of native species in most major terrestrial biomes has fallen by at least 20%, with this decline occurring predominantly since 1900 and accelerating in recent decades.
The geographic scope is planetary. 75% of Earth's land surface has been significantly altered by human activities. 66% of ocean area is experiencing increasing cumulative human pressures. Over 85% of the world's wetlands have been lost. A quarter of all freshwater species are at risk of extinction, despite freshwater ecosystems covering less than 1% of Earth's surface.
The economic stakes match the ecological scale. An estimated US$44 trillion of economic value — over half the world's GDP — is moderately or highly dependent on nature and its services, and therefore threatened by biodiversity collapse. When bees disappear, crops fail. When wetlands are drained, floods worsen. When coral reefs die, a billion people lose a food source. Biodiversity is not a luxury; it is the infrastructure of civilisation.
Understanding why this is happening — and what specific human activities are responsible — is essential for anyone who wants to help reverse it. The rest of this guide examines the five proximate drivers that IPBES has identified as the primary causes of biodiversity loss, with a particular focus on the UK picture and on what 2024–2026 data and policy reveal about the trajectory ahead.
What Are the Five Main Causes of Biodiversity Loss?
The five main causes of biodiversity loss, as identified by the 2019 IPBES Global Assessment and confirmed by subsequent scientific reviews, are:
- Habitat destruction and land-use change — the single largest driver globally, particularly the conversion of natural ecosystems to agriculture.
- Direct exploitation of organisms — unsustainable hunting, fishing, logging, and the wildlife trade. This is the largest driver in marine ecosystems.
- Climate change — currently a significant driver, and projected to become the dominant driver if warming continues.
- Pollution — chemical pollutants, plastics, nutrient runoff, and atmospheric nitrogen deposition.
- Invasive alien species — non-native species introduced to new ecosystems where they disrupt native biodiversity.
These drivers are not independent — they interact and amplify each other. A fragmented habitat is more vulnerable to invasive species. A climate-stressed coral reef is more vulnerable to pollution. An overfished population is more vulnerable to warming seas. All five ultimately trace back to human economic systems, consumption patterns, and governance choices. All five can be addressed — but only if they are first understood.
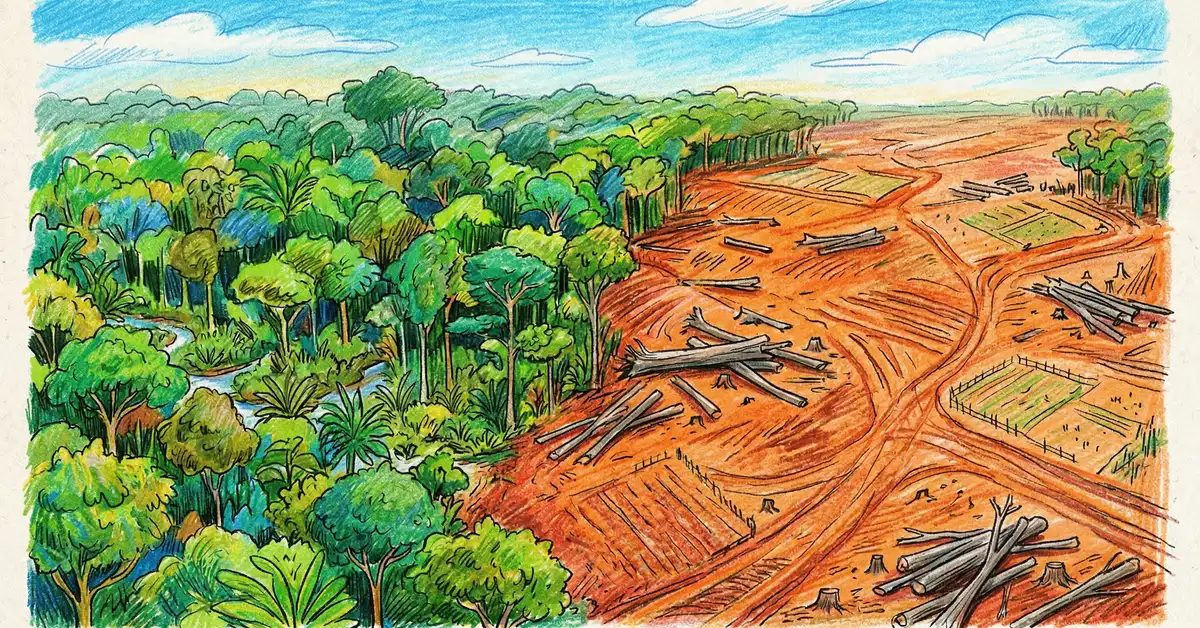
Driver 1: Habitat Destruction — Why Is Land-Use Change the Biggest Threat?
Habitat destruction from land-use change is the largest single driver of biodiversity loss globally, and has had the greatest relative negative impact on terrestrial and freshwater ecosystems since 1970. Agricultural expansion is the dominant form: over one third of Earth's land surface is now used for agriculture or grazing, representing a fundamental transformation of the planet's surface from naturally-shaped ecosystems to human-managed systems.
When natural habitats are cleared, the species that depend on them either vanish outright or are compressed into ever-smaller remnant patches. Fragmented populations then become vulnerable to three compounding threats: random extinction events, loss of genetic diversity through inbreeding, and inability to access essential resources such as seasonal food or breeding sites. Ecological relationships that took millennia to evolve — pollination networks, predator-prey balances, nutrient cycling — break down.
The UK's post-war land-use legacy
The UK's own history illustrates the cumulative impact of land-use change. Between 1946 and 1980, agricultural intensification removed approximately 121,000 kilometres of hedgerows — destroying a landscape feature that had defined the British countryside for centuries and provided vital habitat corridors for small mammals, birds, insects, and wildflowers. Hedgerow loss has continued since, driven by farm expansion and development pressure.
Ancient woodland has fared little better. According to the Woodland Trust's State of the UK's Woods and Trees 2025 report, only 7% of Britain's native woodland is currently in good ecological condition, despite its importance for threatened species. UK peatlands — exceptional carbon stores and home to distinctive specialist species — are in an even worse state, with approximately 80% degraded to some extent. This degradation releases stored carbon, worsens flooding, and destroys habitat simultaneously.
Global deforestation and the Amazon
Globally, deforestation remains our complete guide to deforestation the most visible face of habitat destruction. The latest FAO Global Forest Resources Assessment 2025 shows that deforestation has slowed to 10.9 million hectares per year during 2015–2025, down from 17.6 million hectares annually during 1990–2000. However, this global figure masks a sharp divide: tropical regions harbouring the highest biodiversity continue to lose primary forest at alarming rates.
The Amazon — which holds approximately 10% of the world's species — is showing cautiously encouraging signs. Under the administration of President Luiz Inácio Lula da Silva, Brazilian Amazon deforestation has fallen for two consecutive years, with rates in 2024 roughly a third lower than 2023 and approximately half their 2022 peak. This reversal shows that political will, enforcement, and indigenous land rights together can bend the curve — but also that protection remains fragile and policy-dependent.
Habitat destruction will continue to be the dominant driver of biodiversity loss unless land-use policy, food systems, and development patterns are fundamentally reformed. The UK's mandatory Biodiversity Net Gain regulations, introduced in 2024, represent one attempt to integrate habitat protection into the planning system at source.
Driver 2: Direct Exploitation — How Do Overfishing, Hunting and Wildlife Trade Drive Extinction?
Direct exploitation — hunting, fishing, logging, and collection of animals and plants for trade — is the second-largest global driver of biodiversity loss and the largest driver in marine ecosystems. Technology has made exploitation brutally efficient. Modern fishing fleets use sonar, satellite tracking, and nets that can strip every mobile organism from vast areas of seafloor. Industrial logging can clear primary forest at speeds unthinkable a generation ago.
Overfishing: the global picture
The FAO's 2025 State of World Fisheries and Aquaculture report found that 35.5% of all fishery stocks globally are overfished, while 64.5% are exploited within biologically sustainable levels. Regional variation is dramatic. In the Northeast Pacific, 92.7% of stocks are sustainably fished. In the Southeast Pacific, only 46% are. The difference is governance: effective management, enforced quotas, and protected spawning grounds recover fisheries; their absence collapses them.
Encouragingly, where management has been strengthened, recovery follows. Mediterranean and Black Sea fish stocks show early signs of recovery — fishing pressure has dropped 30% and biomass risen 15% since 2013. This matters because it disproves the claim that marine ecosystems are too damaged to return.
The UK's Atlantic salmon crisis
The Atlantic salmon — once abundant in British rivers and seas — has been reclassified as endangered by the IUCN, with the main UK population now recognised as threatened with extinction. Multiple pressures compound the crisis: weirs and dams blocking migration to spawning grounds, pollution from agricultural runoff and sewage, sea lice from salmon farms, interbreeding with escaped farmed salmon that dilutes wild genetic diversity, and warming rivers that reduce oxygen availability. Losing salmon would cascade through freshwater and coastal ecosystems, disrupting the nutrient flow that transfers marine productivity deep inland.
The wildlife trade
The legal and illegal wildlife trade represents a further form of direct exploitation. The global illegal wildlife trade in CITES-listed species alone is worth approximately $1.8 billion annually — and total illegal wildlife trade value is substantially higher. This trade drives declines in species from African elephants to pangolins to tropical songbirds, creating cascading impacts where keystone species are removed from their ecosystems. UK enforcement, through the Border Force CITES team and the National Wildlife Crime Unit, intercepts a fraction of what passes through British ports and airports each year.
Driver 3: Climate Change — Why Is a Warming World Accelerating Biodiversity Loss?
Climate change is currently the third-largest global driver of biodiversity loss and is projected to become the dominant driver as global temperatures continue to rise. Unlike habitat destruction, which is local and visible, climate-driven biodiversity loss operates through diffuse mechanisms — shifting temperature and rainfall patterns, rising sea levels, changing ocean chemistry, and more frequent and intense extreme weather.
Range shifts and phenological mismatch
As climates warm, species that cannot tolerate higher temperatures must move — usually poleward or to higher altitudes — to find suitable conditions. Many are succeeding; many are not. For a more detailed exploration, see our guide to species most affected by climate change.
A particularly serious mechanism is phenological mismatch — when the timing of life-cycle events in interdependent species falls out of sync. The British Trust for Ornithology's satellite-tracking of common cuckoos has shown that cuckoos are leaving the UK much earlier than previously thought, with over 50% of tagged males departing by the end of June. One tracked individual spent roughly 47% of his year in Africa, 38% on migration, and just 15% in Britain. Because the timing of spring rains in their African wintering grounds is not shifting with climate change, cuckoos are becoming increasingly out of sync with prey availability and host-species breeding — a mismatch that is driving population collapse.
Coral reefs and the fourth global bleaching event
Coral reefs have become the emblem of climate-driven biodiversity loss. In May 2024, the International Coral Reef Initiative declared that the world was experiencing the fourth global coral bleaching event on record. One year on, the event continues to develop. Between 1 January 2023 and 30 March 2025, bleaching-level heat stress affected 84% of the world's reefs, with 82 countries, territories and economies suffering damage. For comparison: during the first global bleaching event in 1998, 21% of reefs were affected. By the third event (2014–2017), the figure had reached 68%. The trajectory is unmistakable.
Why coral reefs matter. Approximately one third of all known marine life depends on coral reefs. One billion people benefit from them directly or indirectly. Reefs provide an estimated $10 trillion in economic benefits through food, jobs, coastal protection, and tourism. Continued reef collapse is projected to cost up to $500 billion annually by 2100. Approximately half the world's live coral cover has already been lost since the 1870s.
Scientists have estimated that limiting global warming to as close to 1.5°C as possible is necessary to give coral conservation a chance of succeeding. Yet current national climate plans put the world on track for approximately 2.7°C of warming. Every tenth of a degree now matters more than ever for the survival of the world's richest marine ecosystems.
Driver 4: Pollution — What Pollutants Harm Biodiversity Most?
Pollution is the fourth-largest driver of biodiversity loss and takes many forms — chemical pollutants entering waterways through agricultural runoff and sewage, atmospheric deposition of nitrogen compounds, pharmaceutical residues, light and noise pollution, and plastic pollution that has now contaminated every environment on Earth from the deepest ocean trenches to the highest mountain summits.
Plastic pollution: 57 million tonnes a year
A comprehensive global study examining waste output from over 50,000 cities and towns found that the planet generates 57 million tonnes of plastic pollution annually that enters the open environment — this excludes plastic properly disposed of in landfills or incinerators. More than two thirds originates in the Global South, reflecting the concentration of rapid urbanisation and inadequate waste management infrastructure. India alone produces 10.2 million tonnes annually, far more than the next most significant sources of Nigeria and Indonesia.
The impacts on wildlife are severe. Marine organisms from whales to sea turtles to seabirds ingest plastic debris, often fatally. Plastic fragments into ever-smaller microplastics that penetrate deep into food chains. Microplastics have now been detected throughout the human body — in blood, lungs, liver, and even lower-limb joints. Studies indicate that people inhale approximately 68,000 microplastic particles daily, with research linking microplastic exposure to increased risk of heart attack, stroke, and potentially Alzheimer's disease.
Pesticides and pollinator collapse
Agricultural pollution — particularly pesticide use — accumulates in soil and water, affecting non-target organisms across entire ecosystems. The FAOSTAT database, updated in July 2024 and covering usage through 2022, shows continued heavy reliance on chemical pesticides in global agriculture. In the UK, pesticide use remains substantial across arable crop production, with the most recent Defra pesticide usage survey covering the 2023–2024 growing season.
The consequences for pollinators are stark. UK pollinators — bees, hoverflies, moths — have decreased by 18% on average since 1970. Predatory insects like the two-spot ladybird, which help control crop pests, have declined by more than a third. Globally, the economic value of crop output at risk from pollinator loss has been estimated at between $235 billion and $577 billion annually. Pollinators are not a niche concern — they underpin approximately 75% of global food crops.
Nutrient pollution and UK chalk streams
Nutrient pollution — from sewage discharge and agricultural runoff — creates dead zones in coastal waters, eutrophication in freshwater systems, and fundamental disruption of ecosystem nutrient cycling. The UK's chalk streams, globally rare and ecologically distinctive, illustrate the scale of the problem: over three quarters of chalk streams are not in good health, and less than a fifth of England's rivers are in healthy condition. Water company sewage discharges, combined with agricultural runoff and over-abstraction, have reduced these systems to a shadow of their natural state.
Driver 5: Invasive Alien Species — How Do Non-Native Species Disrupt Ecosystems?
The fifth major driver of biodiversity loss is the introduction of invasive alien species — non-native species that become established in ecosystems where they did not evolve. Globalisation has created unprecedented opportunities for species to cross geographic barriers that would have been impassable in nature. Ships carry organisms in ballast water, planes transport pathogens, and the global horticultural trade distributes plants that escape gardens to colonise wild habitats.
When non-native species establish in new environments, they often lack the natural predators, parasites, and pathogens that control their populations in their native range. Released from these controls, they can proliferate unchecked — outcompeting native species for resources, preying on native species that lack evolutionary defences, introducing novel diseases, and fundamentally altering ecosystem structure.
Island ecosystems are hit hardest
In regions of high endemism — where a high proportion of species occur nowhere else on Earth — invasive species have historically caused severe damage. Island ecosystems are particularly vulnerable because native island species often have small population sizes, limited genetic diversity, and evolved without predators. The extinction of numerous Hawaiian species resulted from introduced rats, pigs, goats, and mongooses preying on species that had no behavioural response to mammalian predators.
The economic and UK cost
The InvaCost database documents billions of dollars in global economic costs each year from biological invasions — direct damage to agriculture, forestry, and fisheries, plus control and eradication costs and broader ecosystem service losses. In the UK, American mink have contributed to the collapse of water vole populations, grey squirrels continue to displace native reds across much of England, Himalayan balsam and Japanese knotweed dominate riverbanks, and invasive signal crayfish have devastated white-clawed crayfish populations. Control of established invasives is extremely costly, making prevention of new introductions far more cost-effective than managing established invasions.
How Do the Five Drivers of Biodiversity Loss Interact?
The five drivers of biodiversity loss do not operate in isolation. They interact, compound, and amplify each other — producing cascading effects that are often greater than the sum of their parts. Understanding these interactions is essential because it means that tackling a single driver in isolation is rarely enough, and it means that progress on one driver can multiply progress on others.
Fragmentation makes every other driver worse
When habitat is destroyed and remaining patches are fragmented, the surviving populations become disproportionately vulnerable to every other driver. A small, isolated population is more likely to be wiped out by a single pollution event, a single bad weather year, a single disease outbreak, or the arrival of a single invasive predator. Genetic diversity falls, inbreeding depression rises, and the ability of species to shift their range in response to climate change is curtailed because there is no connected habitat to move through. Landscape-scale restoration and ecological connectivity — the principles behind UK nature recovery networks — tackle habitat loss and buffer populations against all four remaining drivers simultaneously.
Climate change accelerates every other pressure
Climate change is unique among the five drivers in that it intensifies all the others. Warming increases the stress from pollution (warm water holds less oxygen, concentrating nutrient-pollution damage). It aids invasive species by opening new climatic niches (Mediterranean species are establishing in southern England). It compounds direct exploitation (warming oceans move fish stocks across political boundaries, undermining existing management). And it amplifies habitat loss by driving fire, drought, and sea-level rise. A species population that could have coped with any one of these pressures in isolation can collapse under the combined weight.
Pollinator decline: a textbook multi-driver case
The 18% decline in UK pollinators since 1970 is not caused by a single driver. It reflects habitat loss (flower-rich meadows reduced by over 97% since the 1930s), pesticide pollution (neonicotinoids and broader chemical burden), climate change (phenological mismatch with flowering times), disease spread partly enabled by the invasive Varroa mite, and the intensification of land use that removes nesting sites. Interventions that address only one driver — banning a specific pesticide, for example — help but do not reverse the trend. Genuine pollinator recovery requires integrated action across all five drivers simultaneously.
Why Is the UK One of the Most Nature-Depleted Countries?
The UK is one of the most nature-depleted countries on Earth, a status reflecting centuries of habitat conversion, persecution of predators, agricultural intensification, and urban expansion. The State of Nature 2023 report, compiled from data gathered by over 60 research and conservation organisations and thousands of skilled volunteers, provides the most comprehensive recent assessment of UK biodiversity.
The report's findings are stark. Species studied across Great Britain have declined by an average of 19% since 1970. One in six of the 10,000+ species assessed — approximately 1,500 species — are at risk of becoming extinct in Great Britain. The risk is unevenly distributed:
- 43% of bird species at extinction risk
- 31% of amphibians and reptiles at extinction risk
- 28% of fungi and lichens at extinction risk
- 26% of land mammals at extinction risk
These are not marginal species — they are widespread components of the British countryside. For a more detailed breakdown, see our full UK biodiversity crisis analysis.
Invertebrates, plants, and woodland in decline
UK invertebrates have been found, on average, in 13% fewer places in the UK compared to 1970. More than half of the UK's flowering plants, mosses, and their relatives have been lost from places where they used to thrive — specifically 54% of flowering plants and 59% of bryophytes have decreased across Great Britain. Woodland wildlife is plummeting despite a marginal increase in tree cover: woodland-associated butterflies fell 47% between 1990 and 2022; woodland birds are down 37% over 50 years (and 15% in the last 5); the hazel dormouse population collapsed by 70% between 2000 and 2022.
Iconic species in crisis
Several of the UK's most endangered species have suffered dramatic declines:
- Turtle dove — Europe's only long-distance migratory dove, numbers collapsed by approximately 99% between their 1960s peak and 2023. A recent international hunting pause is now driving recovery.
- Hedgehog — numbers have decreased by up to 75% in rural areas since the 1950s, according to the State of Britain's Hedgehogs surveys. Habitat loss, pesticide impacts on prey, road casualties, and garden management all contribute.
- Cuckoo — declining with strong regional variation, driven by differential mortality on migration routes through Spain versus Italy, and by phenological mismatch on African wintering grounds.
- Atlantic salmon — main UK population now endangered, facing combined pressures from habitat barriers, pollution, sea lice, and warming rivers.
UK freshwater: a system under siege
The UK's freshwater ecosystems — rivers, chalk streams, wetlands, and ponds — are among the most degraded in the country. Less than 15% of English rivers are in good ecological condition under Water Framework Directive standards, and not a single river achieved "good" chemical status in the most recent Environment Agency assessment. Sewage discharge events from water companies, agricultural nutrient pollution, and over-abstraction together compound the ecological damage. Freshwater species have been disproportionately affected: a quarter of all freshwater species globally are at risk of extinction, despite freshwater covering less than 1% of Earth's surface.
The UK holds 85% of the world's chalk streams — globally rare spring-fed rivers of extraordinary ecological value, supporting species found nowhere else. The fact that three quarters are not in good health is a global biodiversity issue, not just a UK one. Similarly, the Atlantic salmon crisis is a signal that the entire freshwater-to-marine corridor — from headwaters to estuary to sea — has been degraded beyond what the species can withstand. Reversing the freshwater biodiversity crisis will require coordinated action on sewage infrastructure, agricultural reform, abstraction limits, and river barrier removal.
What Policies Exist to Halt Biodiversity Loss?
Multiple policy frameworks now target biodiversity recovery at UK, European, and global levels. Whether they deliver depends on implementation, resourcing, and enforcement.
UK: Environment Act 2021 targets
Under the Environment Act 2021, the UK government set four legally binding biodiversity targets for England: halt species-abundance decline by 2030, reverse species decline by 2042, reduce extinction risk, and restore or create more than 500,000 hectares of wildlife-rich habitat by 2042. For the regulatory mechanism at the heart of the delivery plan, see our guide to BNG regulations and exemptions and the pillar on biodiversity action plans.
UK: mandatory Biodiversity Net Gain
From 12 February 2024, all major development in England must deliver a biodiversity net gain of at least 10% — habitats for wildlife must be left in a measurably better state than before development. Small-site BNG became mandatory from 2 April 2024. Developers must achieve the gain on-site through habitat creation, off-site through purchasing habitat units, or as a last resort by buying statutory biodiversity credits. The policy represents the most ambitious integration of nature recovery into the planning system of any major economy.
Global: Kunming-Montreal Framework (30x30)
At the global level, the Kunming-Montreal Global Biodiversity Framework, agreed in December 2022 by 195 countries under the Convention on Biological Diversity, established 23 action-oriented targets for 2030 — including the protection of 30% of land and sea (the "30x30" target) and the restoration of 30% of degraded ecosystems. However, the UK government's most recent progress assessment found the UK far off track: 19 of 23 targets classified off track, with only 3 on track. In the previous round of targets, the UK missed 17 of 20. Commitments without implementation produce decline, not recovery.
EU: Nature Restoration Regulation
The EU's Nature Restoration Regulation, adopted in June 2024, is the first continent-wide law requiring ecosystem restoration at scale. It requires restoration measures to cover at least 20% of the EU's land and sea areas by 2030, with all ecosystems in need of restoration addressed by 2050. Targets focus on wetlands, rivers, forests, grasslands, marine ecosystems, and their species. The UK is not directly bound by the regulation post-Brexit, but the regulation sets a benchmark by which UK performance can be judged.
Can Biodiversity Loss Be Reversed?
Yes — biodiversity loss can be reversed, and the evidence of recovery is growing. Individual cases of successful reversal now span species, ecosystems, and whole biomes, demonstrating that the biodiversity crisis is a choice rather than a fate.
- Turtle dove recovery — the European Commission's sustainable hunting management system paused turtle dove hunting in France, Spain and Portugal between 2021 and 2024, saving the lives of four million turtle doves and producing a 30%+ increase in the western European population.
- Marine recovery in Lyme Bay — species numbers have increased since trawling was banned in 2008, showing that UK marine protected areas deliver when enforced.
- Mediterranean fish stocks — fishing pressure dropped 30% and biomass rose 15% since 2013 following tightened management.
- Amazon deforestation — Brazilian Amazon deforestation has fallen for two consecutive years under the Lula administration, halving from 2022 levels.
- UK species recovery — the bittern, beaver, large blue butterfly, and red kite have all recovered from local or national extinction through targeted conservation.
Reversal is possible. Delivery requires three things: sustained public investment at the scale of the problem (scientists estimate coral conservation spending alone needs to increase sevenfold), reformed economic incentives that reward rather than punish nature-positive behaviour, and genuine political commitment to follow through on legal targets already set. The UK currently has the policy framework. What it lacks is scale of execution.
What Can You Do to Help Reverse Biodiversity Loss?
Individual action cannot substitute for policy change, but it compounds into cultural and political change. The most effective individual contributions fall into four categories.
1. Create habitat where you are
Make gardens, balconies, and allotments wildlife-friendly: leave corners wild, plant native nectar-rich flowers, provide water sources, install hedgehog highways (CD-sized gaps in fences), avoid pesticides, and choose peat-free compost. Domestic garden networks can deliver landscape-scale habitat at no public cost.
2. Shift your consumption
Reduce single-use plastics. Eat less but better-quality meat. Choose seasonal, locally grown produce. Support sustainable seafood (the Marine Conservation Society's Good Fish Guide is the UK reference). Avoid tropical timber, palm oil, and ingredients linked to deforestation. Consumer demand drives agricultural systems.
3. Contribute to monitoring and restoration
Join a citizen-science programme: the BTO's Garden BirdWatch, Butterfly Conservation's Big Butterfly Count, the UK Ladybird Survey, the River Obstacles app, the Big Hedgehog Map. Volunteer for habitat restoration with The Wildlife Trusts, RSPB, Plantlife, Buglife, or the Woodland Trust. Biodiversity data enables action.
4. Use your political voice
Write to your MP about the UK's biodiversity targets. Respond to government consultations on planning, agriculture, and water. Support organisations that advocate for nature. Vote with biodiversity as a criterion. Policy is decided by the people who show up — whether that's investors, lobbyists, or voters.
Frequently Asked Questions About Biodiversity Loss
What are the five main causes of biodiversity loss?
The five main causes of biodiversity loss identified by the IPBES are: (1) habitat destruction through land-use change, particularly agricultural expansion, (2) direct exploitation through unsustainable hunting, fishing, and the wildlife trade, (3) climate change, (4) pollution from plastics, pesticides, and nutrient runoff, and (5) invasive alien species. These drivers interact and amplify each other, and all trace back to human economic and governance choices.
What is the single biggest cause of biodiversity loss?
Habitat destruction from land-use change — particularly the conversion of natural ecosystems to agriculture — is the single largest driver of biodiversity loss globally. It has had the greatest negative impact on terrestrial and freshwater ecosystems since 1970. Over one third of Earth's land is now used for agriculture or grazing, and more than 85% of the world's wetlands have been lost.
How does climate change cause biodiversity loss?
Climate change drives biodiversity loss through multiple mechanisms: shifting temperature and rainfall patterns force species to move poleward or to higher elevations; rising ocean temperatures cause mass coral bleaching (84% of reefs affected in the 2023–2025 event); phenological mismatch disrupts synchronised breeding and migration timings; extreme weather events directly kill wildlife; and ocean acidification harms shell-forming species. Species that cannot move or adapt fast enough face extinction.
What is the IPBES and what did its 2019 report conclude?
The Intergovernmental Science-Policy Platform on Biodiversity and Ecosystem Services (IPBES) is an independent intergovernmental body providing scientific assessments of biodiversity and ecosystem services. Its 2019 Global Assessment — built on 450+ experts reviewing 15,000+ papers — concluded that approximately one million animal and plant species face extinction in the coming decades unless human pressures are substantially reduced, and it identified the five main drivers of biodiversity loss.
How much biodiversity has the UK lost?
The UK has lost approximately half of its biodiversity and ranks among the most nature-depleted countries on Earth. Since 1970, studied species have declined by an average of 19%. One in six UK species — around 1,500 — are now at risk of extinction, including 43% of birds, 31% of amphibians and reptiles, and 28% of fungi and lichens. Post-war agricultural intensification removed 121,000 km of hedgerows, and 80% of UK peatlands are degraded.
Can biodiversity loss be reversed?
Yes. Evidence shows biodiversity can recover when genuine effort is applied. Western European turtle dove populations have risen over 30% since hunting was paused in 2021. Marine life has returned to Lyme Bay since trawling was banned in 2008. Mediterranean fish stocks are recovering under tightened management. The UK bittern, beaver, and large blue butterfly have all come back from the brink. Full global recovery requires systemic changes to land use, fisheries, climate, pollution, and invasive-species policy.
Conclusion: A Moment of Decision
The five drivers of biodiversity loss — habitat destruction, direct exploitation, climate change, pollution, and invasive species — are the proximate causes of the extinction crisis. They are deeply interconnected, mutually reinforcing, and all ultimately traceable to human economic systems, consumption patterns, and governance structures. The scale is extraordinary: 73% of monitored wildlife populations lost since 1970, and around one million species facing extinction.
The UK exemplifies the global pattern, with species down 19% since 1970 and one in six threatened. But the UK also exemplifies what is possible: a legally binding biodiversity framework, mandatory BNG, the world's largest citizen-science monitoring network, and documented recoveries of species once considered lost. The question is no longer whether biodiversity loss can be reversed. The evidence shows that it can. The question is whether we will act — at the scale, speed, and seriousness the moment demands — before the tipping points are crossed and the losses become permanent.
Further reading: Why biodiversity matters · Conservation strategies that work · Ecosystem services explained · Biodiversity Net Gain defined.
mass extinction
species extinction
human health