Key Takeaway
Biodiversity is not a single number. Ecologists measure it across three spatial scales — alpha (local species richness), beta (species turnover between habitats) and gamma (total regional diversity) — and increasingly through functional, phylogenetic and genetic dimensions. Understanding all six types is essential for effective conservation because protecting species richness alone does not guarantee resilient ecosystems.
~55,000
UK Native Species
Fauna, flora and fungi
19%
Average Decline
UK wildlife over 40 years
1 in 6
Species Threatened
With extinction in GB
59%
Insect Decline
Flying insects in 5 years
Sources: Defra Species Abundance Indicators 2024, Buglife Bugs Matter Survey 2025
In This Article
- Alpha Diversity: Species Richness at the Local Scale
- Beta Diversity: Species Turnover Between Habitats
- Gamma Diversity: The Regional Species Pool
- Functional Diversity and Ecosystem Resilience
- Phylogenetic Diversity and EDGE Species
- Genetic Diversity Within Species
- How Biodiversity Is Measured: Simpson's vs Shannon-Wiener
- Practical Applications in UK Conservation
Alpha Diversity: Species Richness at the Local Scale
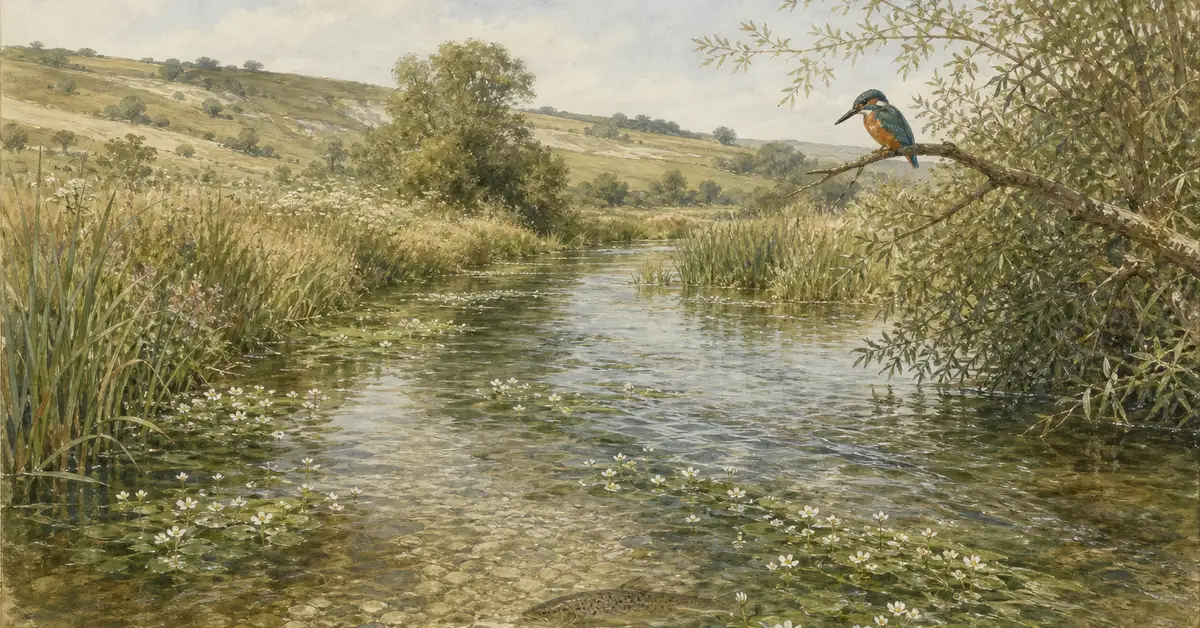
Alpha diversity (α-diversity) measures the number and relative abundance of species within a single habitat or site. It answers a deceptively simple question: how many species live here, and how evenly are they distributed? A chalk grassland in the North Downs supporting 40 plant species per square metre has high alpha diversity. A monoculture wheat field supporting three or four species in the same area has low alpha diversity. The concept was formalised by ecologist Robert Whittaker in 1972 as part of his hierarchical framework for understanding biodiversity at different scales.
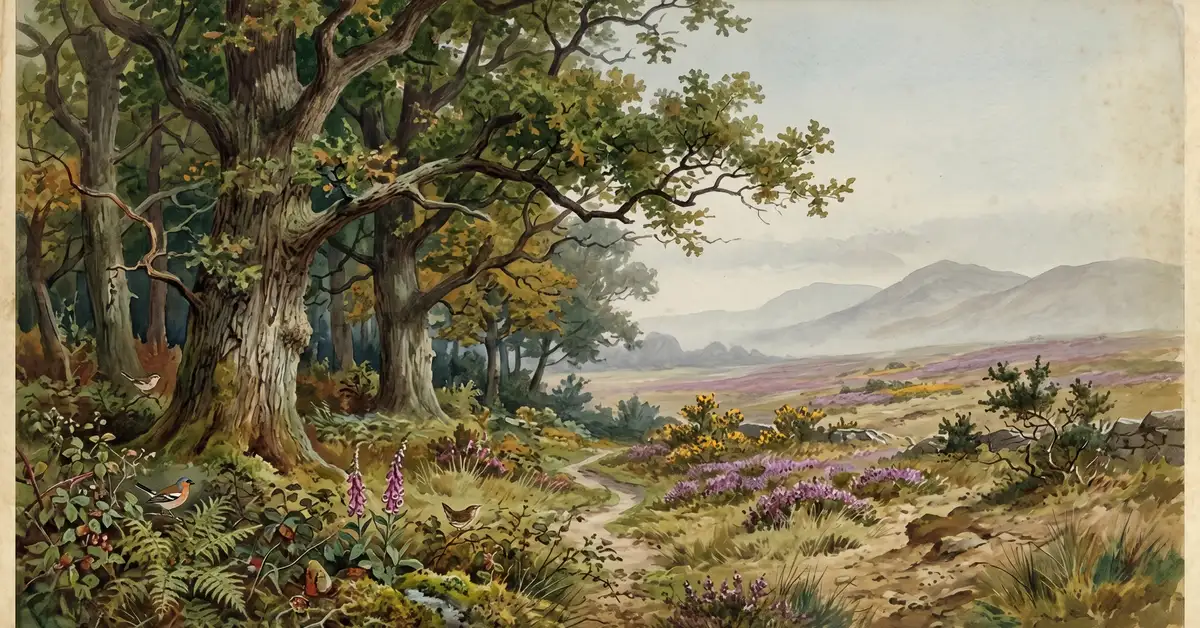
UK habitats vary enormously in alpha diversity. Lowland calcareous grasslands — dependent on chalk and limestone soils — support between 20 and 40 plant species per four square metres when well managed, alongside proportionally higher bryophyte (moss) diversity than any other British grassland type. Ancient woodland supports more species than any other land-based habitat in the UK, with research showing that increasing broadleaf canopy cover from zero to 20 per cent in planted forests correlates with a 63 per cent increase in plant species compared to conifer monocultures. At the other extreme, intensive arable farmland and sealed urban surfaces support minimal species richness.
Alpha diversity alone, however, tells an incomplete story. A site might support many species while missing ecologically important ones, or two sites might score identically on alpha diversity while supporting completely different species assemblages. This is where beta diversity becomes essential.
Beta Diversity: Species Turnover Between Habitats
Beta diversity (β-diversity) measures the difference in species composition between habitats or sites — the degree to which separate communities contain different species. Whittaker originally defined it as a simple ratio: β = γ ÷ α, dividing total regional diversity by average local diversity. A high beta diversity value indicates that different habitats support distinctly different species assemblages, while a low value indicates that the same species turn up everywhere.
Beta diversity carries profound implications for conservation planning. Consider a landscape containing three distinct habitat types — woodland, hedgerow and grassland — each supporting 30 species. If those habitats share no species at all (maximum beta diversity), the landscape supports 90 species in total. If all three habitats support identical species (minimum beta diversity), the landscape supports just 30 species regardless of how many reserves are created. Protecting habitat diversity across a landscape therefore captures far more total biodiversity than protecting multiple examples of the same habitat type.
High Beta Diversity
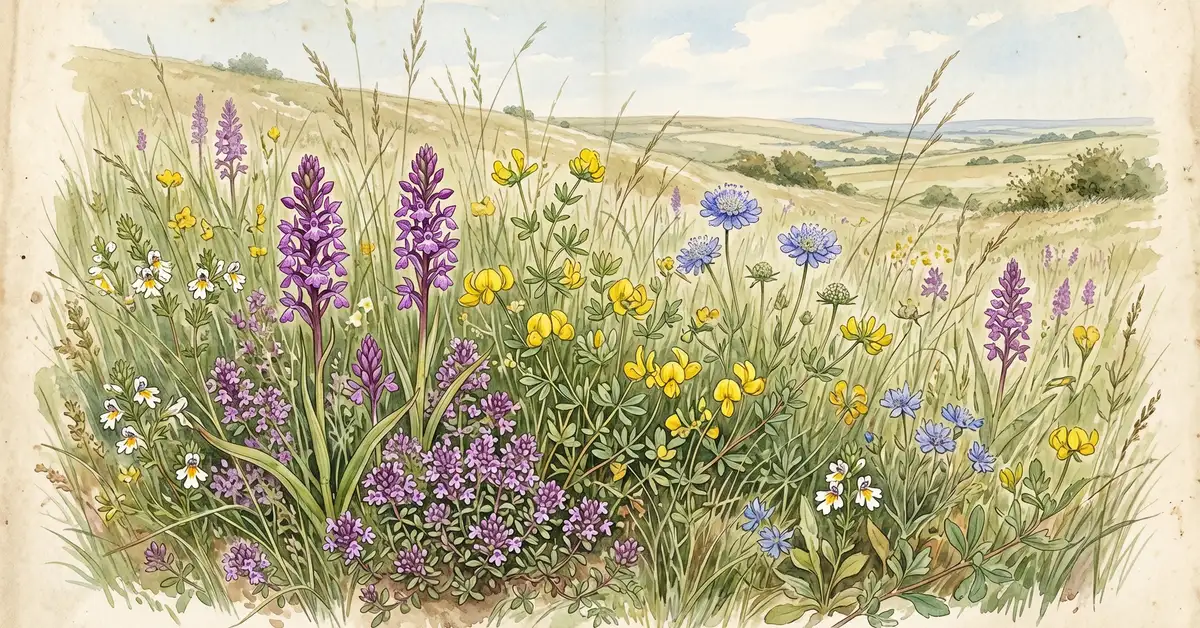
Different habitats support different species. Lowland calcareous grassland supports calcicole specialists (bee orchid, wild thyme, fairy flax) while adjacent acidic heathland supports heather, bilberry and sundew — almost no overlap despite close proximity. Protecting both habitats captures far more species than doubling the area of either one.
Low Beta Diversity
Similar habitats support similar species. Two improved grassland fields separated by a mile contain largely the same suite of common grasses, docks, thistles and dandelions. Protecting both adds little to overall species diversity. Conservation effort is better directed at finding and protecting different habitat types.
UK grasslands illustrate high beta diversity across subtypes. Lowland calcareous grassland on chalk supports completely different specialist species from upland calcareous grassland above 250 metres, which in turn differs from neutral lowland meadows on clay soils. Research on post-industrial extraction sites has confirmed that pioneer habitats with open bare ground specifically drive high plant beta diversity, suggesting that brownfield sites with diverse microhabitats can support considerable species turnover despite their disturbed appearance.
Gamma Diversity: The Regional Species Pool
Gamma diversity (γ-diversity) represents total species richness across an entire region or landscape — the cumulative result of local richness (alpha) multiplied by community differentiation (beta). In mathematical terms: γ = α × β. Gamma diversity provides the largest spatial scale in Whittaker's framework, establishing the upper boundary against which local and turnover diversity operate.
The UK is home to approximately 55,000 native species of fauna, flora and fungi. Invertebrates dominate this total — 53 per cent of all recorded UK species are invertebrates, including nearly 24,000 insect species. Fungi account for about 32 per cent (roughly 15,000 species), plants for nine per cent and vertebrates for barely one per cent (362 recorded species). Scotland alone hosts over 1,600 vascular plants, more than 1,500 lichens and nearly 1,000 bryophytes — an extraordinary bryophyte concentration reflecting Scotland's oceanic climate and abundant moist rocky habitats.
In global context, the UK's gamma diversity paints a sobering picture. The UK retains approximately 50 per cent of its historical biodiversity compared to a global average of 75 per cent, making it one of the world's most nature-depleted countries. This depletion reflects centuries of forest clearance, agricultural intensification and urbanisation — long predating the systematic monitoring that began in 1970.
Functional Diversity and Ecosystem Resilience
Functional diversity measures variation in ecological roles and strategies within a community — not how many species exist but what they do. Functional traits include body size, feeding behaviour, reproductive strategy, pollination method and seed dispersal mechanism. A woodland with insectivorous birds, seed-dispersing mammals, decomposing fungi, nitrogen-fixing plants and pollinating insects has high functional diversity because its species perform many different ecological roles.
The critical concept here is functional redundancy — having multiple species capable of performing the same ecological function. Redundancy acts as ecological insurance: if one pollinator species declines, others can partially compensate. A landmark study published in Nature compiled data for nearly 3,700 bird species across 1,200 sites worldwide, revealing that habitat modification reduces functional diversity and — critically — strips away functional redundancy even when species richness remains relatively high. Disturbed habitats become dominated by a few generalist species occupying similar niches, triggering cascading effects including reduced forest regeneration, diminished carbon storage and proliferation of crop pests.
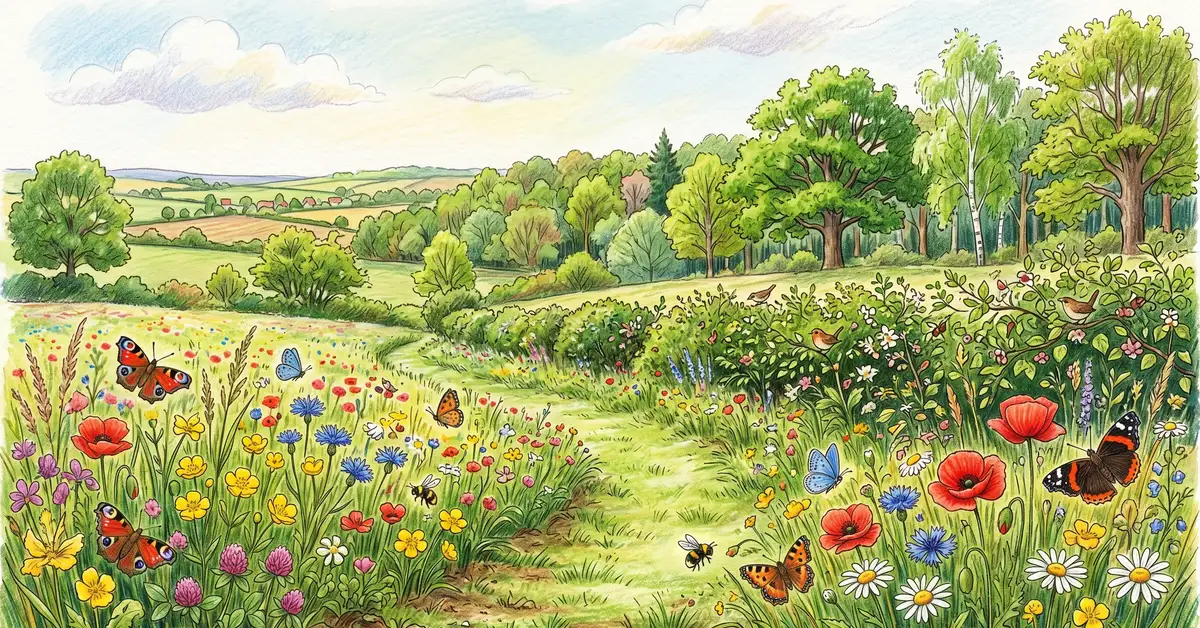
UK wildflower meadows demonstrate functional diversity in action. Different plant species offer nectar at different times of year, attract different pollinator species, grow to different heights providing varied foraging niches, and support different herbivore communities. Ancient woodland adds another dimension: roughly one fifth of woodland species depend on deadwood habitats — a functional resource absent from commercial plantation monocultures.
Phylogenetic Diversity and EDGE Species
Phylogenetic diversity measures the total evolutionary history represented by a group of species, calculated as the sum of all branch lengths connecting species on an evolutionary tree. Faith's Phylogenetic Diversity (PD) index, developed in 1992, quantifies this by summing the millions of years of evolutionary history within a species assemblage. Species occupying isolated branches — those with few close relatives — contribute disproportionately to phylogenetic diversity because their extinction eliminates unique evolutionary lineages that cannot be recovered.
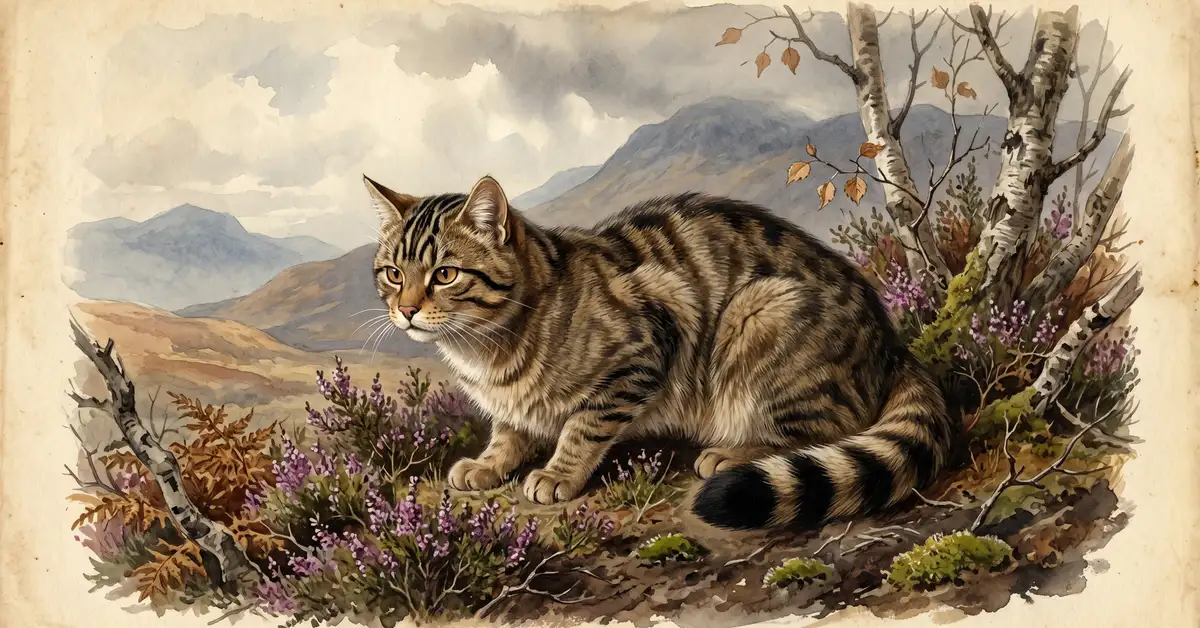
The EDGE framework (Evolutionarily Distinct and Globally Endangered) explicitly combines phylogenetic distinctiveness with extinction risk. EDGE species represent irreplaceable evolutionary lineages facing high extinction probability. In the UK, several EDGE-priority species demand attention. The Scottish wildcat — the most critically endangered mammal in Britain — faces extinction through hybridisation with feral domestic cats. Recent research suggests reintroducing wildcats to South West England could prove feasible and help secure the species' future. The rare pine hoverfly has been the subject of a captive breeding programme, with the Royal Zoological Society of Scotland celebrating the release of its 30,000th specimen into the Cairngorms National Park.
Genetic Diversity Within Species
Genetic diversity — variation in DNA within a single species — represents the finest scale of biodiversity and underpins a species' capacity to adapt to environmental change. Populations with low genetic diversity face increased vulnerability to disease, inbreeding depression and inability to evolve responses to new threats such as climate change or novel pathogens.
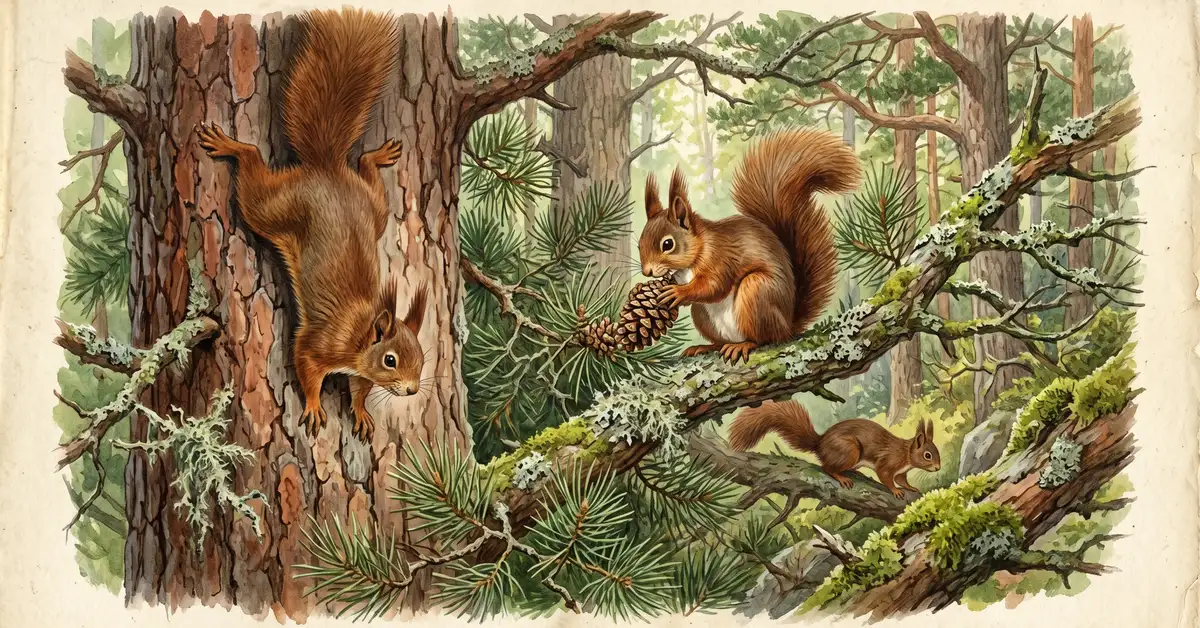
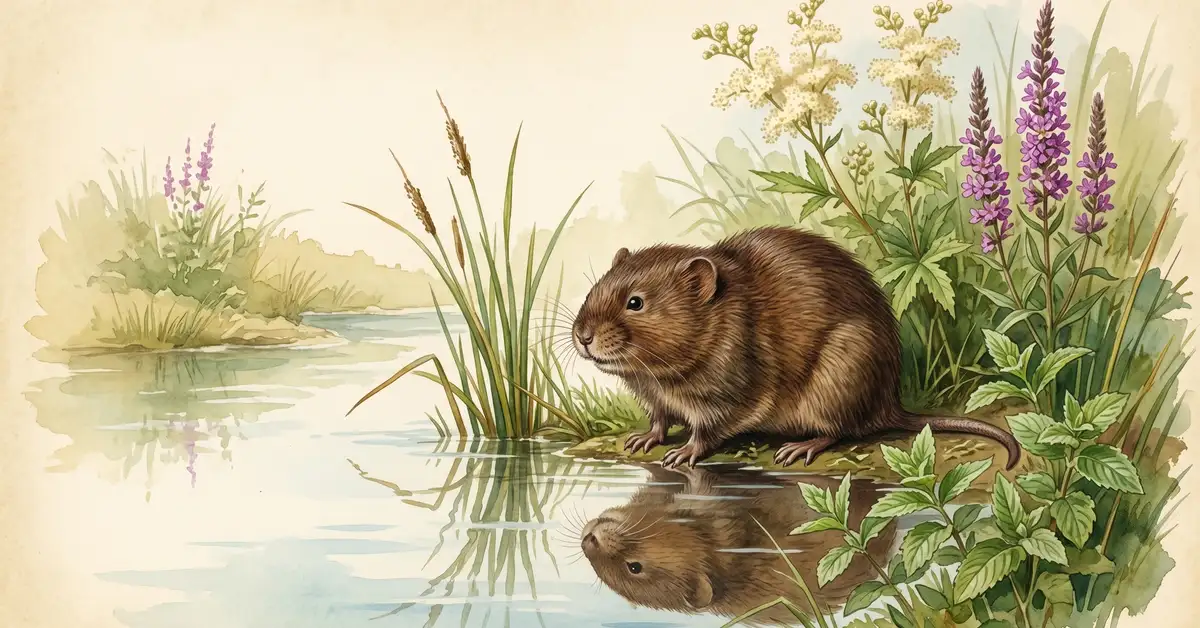
Several UK species illustrate the consequences of genetic depletion. Analysis of British polecat populations revealed a severe genetic bottleneck approximately 30 to 40 generations ago (around 1854), with Welsh populations showing significantly lower genetic diversity than English counterparts. The UK's 287,000 red squirrels — 80 per cent concentrated in Scotland — survive in small, genetically isolated populations in England and Wales. Water voles have disappeared from over 95 per cent of their former UK range, with surviving populations genetically fragmented and vulnerable to inbreeding.
Genetic diversity also matters for rewilding and reintroduction programmes. Translocating genetically inappropriate individuals can cause outbreeding depression — reduced fitness in hybrid offspring — highlighting the need for careful genetic matching between source and release populations.
How Biodiversity Is Measured: Simpson's vs Shannon-Wiener
Two indices dominate practical biodiversity measurement, each emphasising different ecological properties.
| Feature | Shannon-Wiener Index (H′) | Simpson's Diversity Index (1-D) |
|---|---|---|
| What it measures | Uncertainty in species identity of a random individual | Probability that two random individuals belong to different species |
| Emphasis | Sensitive to rare species and overall species richness | Emphasises species evenness and dominance patterns |
| Value range | 0 to ~4 (no upper limit; values above 3 indicate high diversity) | 0 to 1 (higher values indicate greater diversity) |
| Best used when | Conservation goals prioritise rare species protection | Conservation goals prioritise equitable abundance distribution |
| Limitation | Sensitive to sampling bias in rare species | Less sensitive to differences in species richness |
Neither index alone captures the full picture of biodiversity. Shannon-Wiener values below 2 generally indicate low diversity, values between 2 and 2.5 indicate moderate diversity, and values above 3 indicate high diversity. In practice, the choice between indices depends on the conservation question being asked — and increasingly, ecologists use both alongside functional and phylogenetic metrics to build a multi-dimensional picture of ecosystem health.
Practical Applications in UK Conservation
All six types of biodiversity now feed directly into UK conservation policy and development planning. The Statutory Biodiversity Metric used for mandatory Biodiversity Net Gain (BNG) calculations operationalises alpha and beta diversity concepts through its habitat distinctiveness scoring — habitats with high species richness and restricted geographic distribution receive higher distinctiveness scores. BNG regulations require developers to measure ecological value before and after development, demonstrating a minimum 10 per cent measurable gain.
Sites of Special Scientific Interest (SSSIs) — the UK's principal statutory habitat protection mechanism — are designated partly for high local species richness (alpha diversity) and partly for supporting community types with restricted geographic distribution (high beta diversity). Local Nature Recovery Strategies (LNRS) apply gamma diversity principles at the regional scale, recognising that landscape-level habitat diversity is needed to sustain comprehensive species pools.
Why Single Metrics Fall Short
Recent research testing the relationship between the BNG statutory metric and actual biodiversity outcomes has raised concerns that area-condition metrics may poorly represent true ecological value. A community can score well on species richness while losing functional redundancy — the ecological insurance that keeps ecosystems stable. Effective conservation requires looking beyond any single number to consider richness, evenness, turnover, function, evolutionary history and genetic variation together.
Environmental Impact Assessments (EIAs) for development proposals draw on multiple biodiversity dimensions. Phase 1 habitat surveys map alpha diversity across development sites; consideration of surrounding habitats incorporates beta diversity; and assessments of impacts on protected species increasingly recognise phylogenetic and genetic considerations — particularly for species recovery programmes involving translocation or reintroduction where genetic matching is essential.
Frequently Asked Questions
What is the difference between alpha, beta and gamma diversity?
Alpha diversity measures species richness within a single habitat or site. Beta diversity measures the difference in species composition between habitats — how much species turnover occurs across a landscape. Gamma diversity measures total species richness across an entire region. They are related by the formula γ = α × β, meaning regional diversity results from local richness multiplied by the degree of differentiation between communities.
What is functional diversity and why does it matter?
Functional diversity measures the range of ecological roles performed by species in a community — pollination, seed dispersal, predation, decomposition and so on. It matters because ecosystem stability depends not just on how many species are present but on whether key ecological functions are being performed. Loss of functional redundancy (multiple species performing the same role) leaves ecosystems vulnerable to collapse even when overall species numbers remain relatively high.
What is the Shannon-Wiener diversity index?
The Shannon-Wiener diversity index (H′) is a mathematical measure of biodiversity that accounts for both the number of species and the evenness of their abundance in a sample. It measures uncertainty in the species identity of a randomly selected individual. Values below 2 indicate low diversity, values between 2 and 2.5 indicate moderate diversity, and values above 3 indicate high diversity. The index is particularly sensitive to rare species.
What are EDGE species?
EDGE stands for Evolutionarily Distinct and Globally Endangered. EDGE species occupy isolated branches on the tree of life with few close relatives and face high extinction risk. Their loss would eliminate unique evolutionary lineages representing millions of years of independent evolution. UK examples include the Scottish wildcat, red squirrel and pine hoverfly. The EDGE framework helps conservationists prioritise species whose extinction would cause the greatest loss of evolutionary history.
How many species are there in the UK?
The UK is home to approximately 55,000 native species of fauna, flora and fungi. Invertebrates make up 53 per cent of this total (including nearly 24,000 insect species), fungi account for about 32 per cent, plants for 9 per cent and vertebrates for just 1 per cent (362 recorded species). However, many groups — particularly fungi, soil invertebrates and non-vascular plants — remain substantially under-counted despite their ecological importance.
Why is genetic diversity important for conservation?
Genetic diversity — variation in DNA within a species — determines a population's capacity to adapt to environmental change, resist disease and avoid inbreeding depression. UK species such as the Scottish wildcat, red squirrel and water vole survive in small, genetically isolated populations with reduced adaptive potential. Conservation programmes must consider genetic matching when translocating individuals to avoid outbreeding depression while maintaining enough genetic variation for long-term survival.
Further Reading
- The Three Levels of Biodiversity: Genetic, Species and Ecosystem
- The Importance of Biodiversity
- Biodiversity and Conservation: The UK Guide
- UK Biodiversity Profile: Species, Habitats and Patterns
- BNG Metrics and Calculation Guide
- UK Endangered Species
Sources: Defra Species Abundance Indicators 2024, Natural History Museum Functional Diversity Study, Plantlife Priority Grasslands Briefing 2025, British Polecat Genetic Study, Buglife Bugs Matter 2025, Natural England SSSI Guidance